This chapter gives an overview of the modeling surface of the application. Figure 1 shows an overview of the modeling surface.
The areas marked by numbers are explained in detail below.
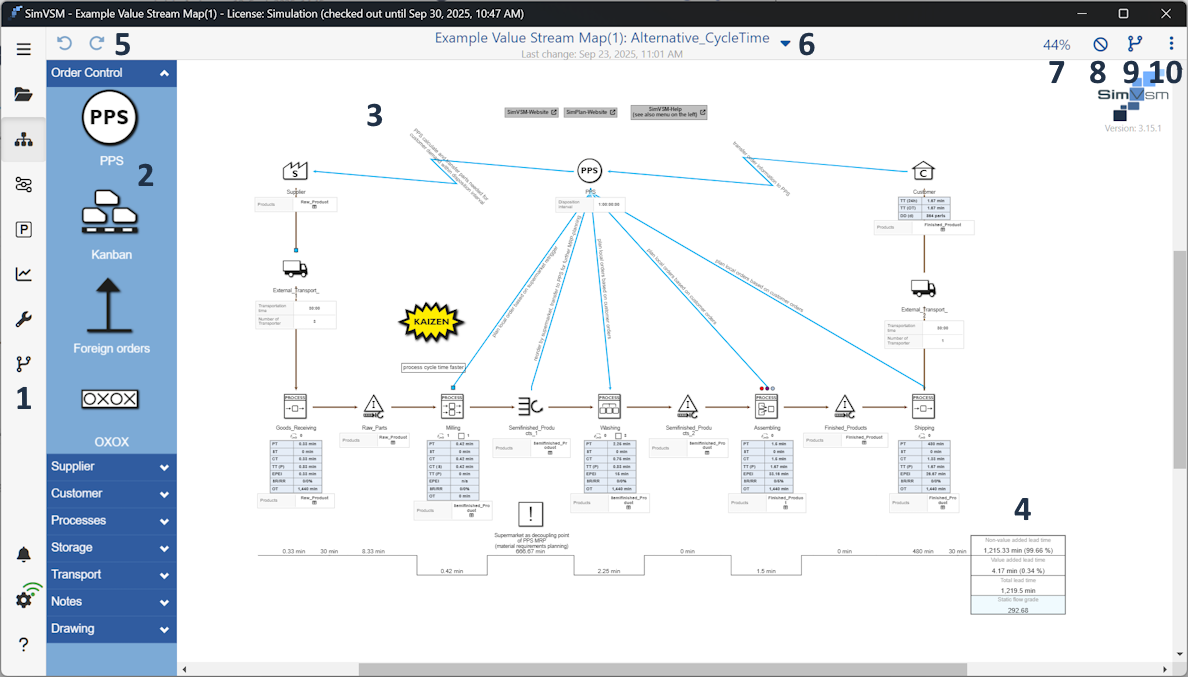
Figure 1 - Modeling area
On the left side of the application there is the menu. Details about the menu can be found in the chapter Menu Bar.
The toolbox contains a variety of value stream objects. These can be dragged to the right onto the modeling surface by drag & drop to create a model.
A description of the individual value stream objects can be found in the chapter of the Objects of the value stream toolbox. How to handle with the value stream objects can be found in the chapter Handling value stream objects.
The largest space of the application is available for modeling. Models can be created and managed here. Instructions can be found in the chapter Handling value stream objects and in the chapter Walk through guide.
Zoom Functionality
In the desktop version of the application it is possible to zoom in while holding down the [CTRL] key and simultaneously moving the mouse wheel in the toolbox.
In the tablet or smart phone version, this functionality can be accessed via the standard zoom gesture (see Figure 2 and 3).
Figure 2 - Zoom in |
Figure 3 - Zoom out |


This area displays the time line of modeling, together with the key Figures Non-value-adding throughput time, Value-added process time, and Static flow rate.
The two buttons back and forth can be used to undo or repeat actions that have been performed, such as inserting objects.
Changes to parameter settings are not affected by this action.
The name of the currently selected project and the currently selected alternative is displayed here (Project name: Alternative name).
The time of the last change in the modeling interface is always displayed below.
Clicking on the arrow icon next to the project name opens a menu where you can configure various settings for the current project.

Figure 4 - Top menu bar
Edit Project Info opens a dialog box in which you can change the name and description of the project.
Upload Project uploads the project to the server (with a preceding query as to whom the project should be released).
Export Project opens a dialog box in which you can set export settings before exporting the project as a *.simvsm file (see also Local Projects Section 5. Exporting a Local Project as a File).
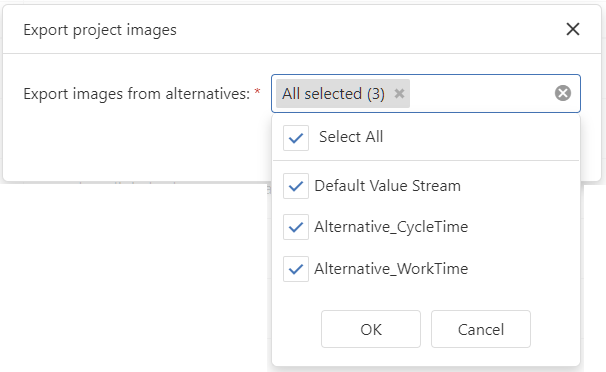
Export Images opens a dialog box in which the images in the project can be exported. The dialog box allows you to select whether images should be exported from specific or all alternatives (see Figures 5 + 6).
The result is a *.zip file named after the respective project name.
Figure 5 - Image export dialog |
Figure 6 - Image export dialog |

By clicking on the percentage value, different zoom settings can be performed, as shown in the below figure.

Figure 7 - Zoom settings
Using the Hide button, it is possible to select elements via a drop down that are to be hidden on the modeling interface.
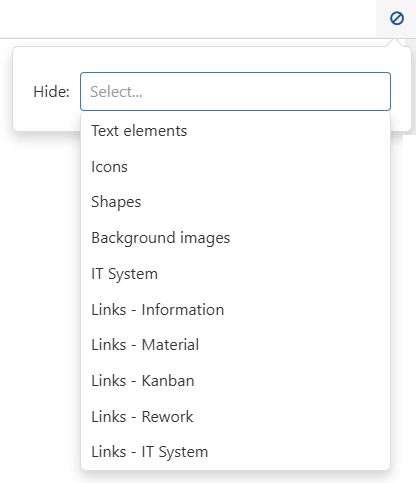
Figure 8 - Hide elements
Clicking on the Alternatives Button |
|
opens the “Alternatives” sidebar, where alternatives can be created and managed. Details can be found in the chapter Create and organize alternatives. |
Clicking on the More button |
|
opens a drop-down menu with various settings for the modeling interface, which are explained below. |
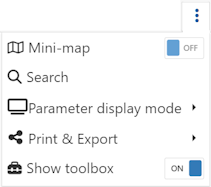
Figure 9 - Settings modeling surface
Mini map
The Mini map button can be used to show or hide an overview window that helps to keep an overview of the entire modeling, especially for larger value streams.
Search
By clicking on the magnifying glass button, objects can be searched for via a dialog. The figure opposite shows the dialog with the drop-down menu open, which contains all the objects used on the modeling surface.
As soon as an element has been selected and the search has been started via the Search button, the corresponding element is then selected on the modeling surface and this is centered on the respective object.

Figure 10 - Search
Parameter display mode
The button Parameter display mode displays a drop-down list where you can specify the level of detail in which the parameters of the objects should be displayed.

Figure 11 - Parameter display mode
Optionally, the parameter display can also be changed by double-clicking on a free space in the modeling area.
The following views are available:
•Display: All
•Display: Compact
•Display: None
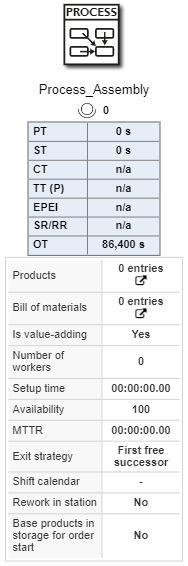
Figures 12-14 show an example of a parameter view.
Figure 12 - Display all |
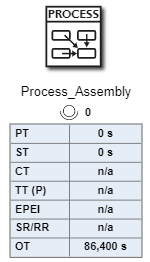
Figure 13 - Display compact |
Figure 14 - Display none |

Using the Print & Image Export button, the currently selected alternative can be either printed or exported as an image (*.png) or as SVG.
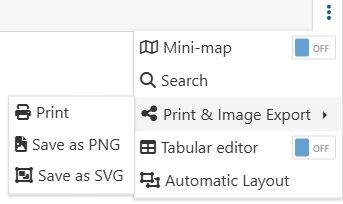
Figure 15 - Print and export
Save as image/SVG
To export as image (*.png) or as SVG, simply select the corresponding entry in the drop down. Then Windows Explorer opens and the file can be saved.
|
Note: When importing exported SVG files into PowerPoint presentations or other Office applications, the following display issues may occur: •Object names are displayed as black boxes: oThe background color of the name labels uses CSS Color Level 4 syntax. oOffice only supports SVG 1.1-compliant RGB without an alpha channel and defaults to black.
•FontAwesome icons are missing: oThe SVG file embeds FontAwesome as a web font. oThe Office SVG renderer does not support embedded web fonts, which is why the icons are not displayed.
•Object icons may be missing: oThe object icons are embedded as <image> with a data:image/svg+xml source. oOffice may not support nested SVGs via data URLs.
Solution / Recommended Action: Export as *.png if the graphic is to be used in Office applications afterward |
Printing alternatives
A click on Print opens the print preview then opens (Figure 7). The print settings can be found in the side menu. Here, the current alternative can also be printed directly as a PDF.
It is also possible to have the width of the PDF to be generated calculated automatically depending on the aspect ratio of the value stream by activating the Dynamic width check box.
The button at the end of the page menu opens the system printer settings. The Print button can be used to print the selected alternative. The Cancel button can be used to switch back to the previous view.
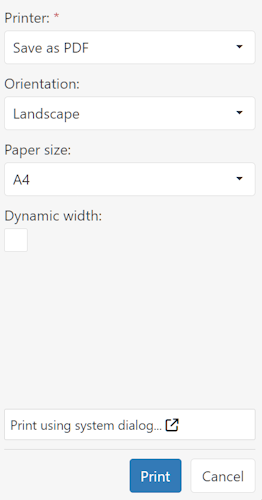
Figure 16 - Print preview
Show toolbox
This slider can be used to show or hide the toolbox.
© SimPlan AG - Hanau District Court, Commercial Register (Part B) 6845 - info@simplan.de - www.simplan.de/en