This results section contains various statistics on process utilization statistics and other statistics that were determined using process utilization statistics.
Contents
1. Process Utilization (whole simulation time)
2. Process Utilization data (whole simulation time)
4. Process Utilization (operational simulation time, BNZ)
5. Process Utilization data (operational simulation time, BNZ)
6. Rework - Process Utilization (whole simulation time)
7. Rework - Process Utilization data (whole simulation time)
8. Rework - Process Utilization (operational simulation time, BNZ)
9. Rework - Process Utilization data (operational simulation time, BNZ)
10. Number of workers (defined vs. theoretical)
The following table shows a categorization of process states for active time, operating time and process utilization
Status |
Color |
Active time |
Operating time |
Workday |
Working |
|
x |
x |
x |
Setting-up |
|
x |
x |
x |
Failed |
|
x |
x |
x |
Rework |
|
x |
x |
x |
Waiting_Orders |
|
|
x |
x |
Waiting_PartsPush |
|
|
x |
x |
Waiting_Parts |
|
|
x |
x |
Blocking |
|
|
x |
x |
Paused |
|
|
|
x |
Unplanned |
|
|
|
x |
Figure 1 shows an overview of individual distributions of the key figure process utilization.
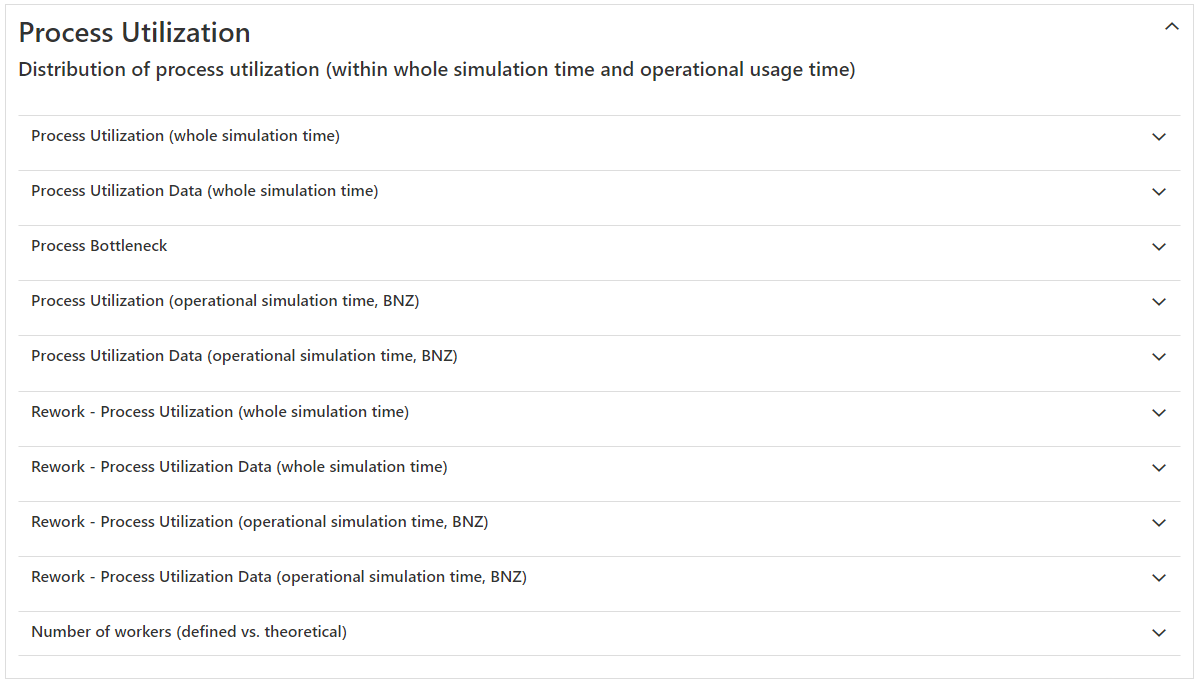
Figure 1 - Overview Process Utilization
1. Process Utilization (whole simulation time)
The diagram shows the percentage process states for each process object in a stacked diagram.
The process state portions are related to the whole simulation time (minus statistics reset) and also include unplanned and paused portions.
The waiting shares are divided into:
•Waiting_Orders (Waiting for information flow input for new local orders; only occurs if a process station is information (/Kanban) flow controlled)
•Waiting_PartsPush (Waiting for new entering parts, which generates a local order in a station without information flow input, i.e. the station would be a process in a push modeling; depending on the type of control (edge input available or not) only Waiting_Order or Waiting_PartsPush can occur
•Waiting_parts (waiting for basic parts after a local order has been received to produce a part; case study: uncontrolled assembly station (parts input by push), which also requires add-on parts from side storage with insufficient supply)
Via the menu button |
|
the respective diagram can either be printed or exported in the desired format. |
In addition to the pivot diagram, a corresponding data view is also inserted below (see Figures 2 and 3).
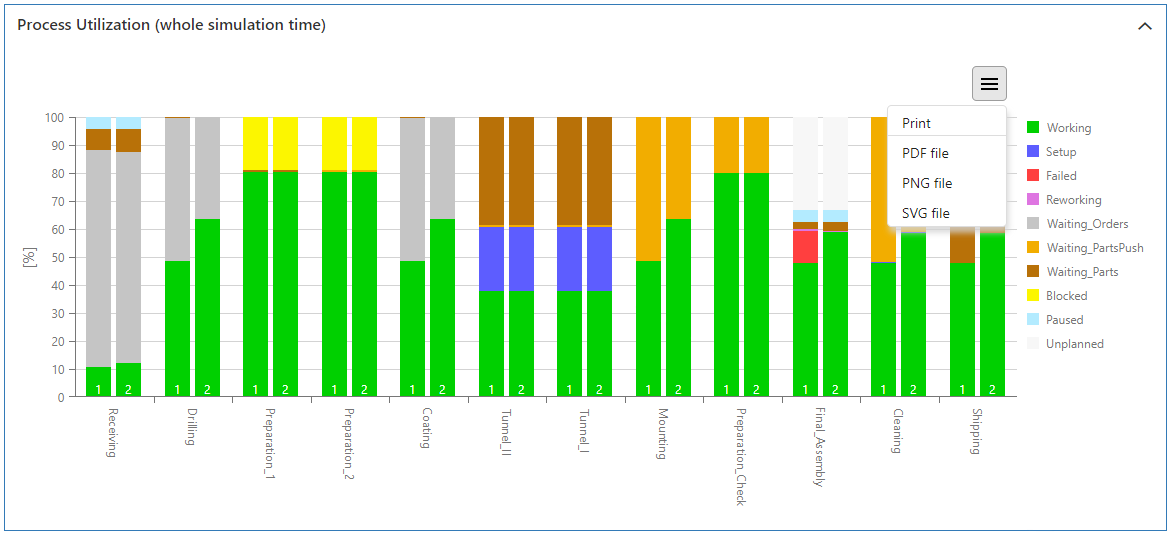
Figure 2 - Process Utilization (whole simulation time)
2. Process Utilization data (whole simulation time)
Via the Excel button |
|
statistics can be exported directly as xlsx file. |
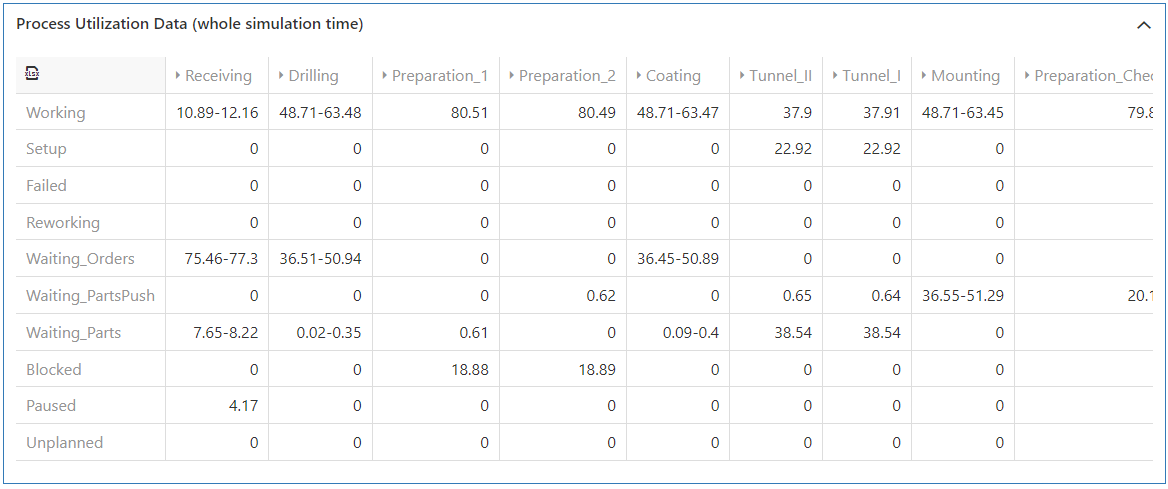
Figure 3 - Process Utilization data (whole simulation time)
Figure 4 shows the representation of calculated bottleneck KPIs for each process. This value is derived from the quotient of the active time and the operating time of a process (bottleneck KPI formula).
The process with the largest bottleneck KPI is highlighted in red as a bottleneck.
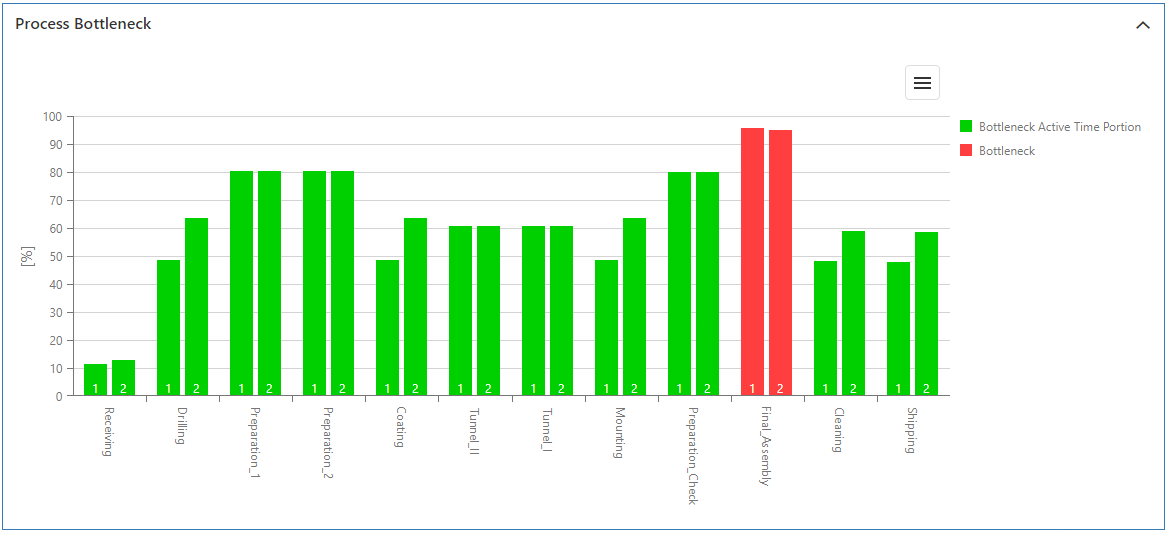
Figure 4 - Process Bottleneck
4. Process Utilization (operational simulation time, BNZ)
The diagram in Figure 5 shows the percentage process states for each process object, normalized to the operating time and thus without the portions for unplanned and paused.
The diagram display is supplemented by a table display (see Figure 6).
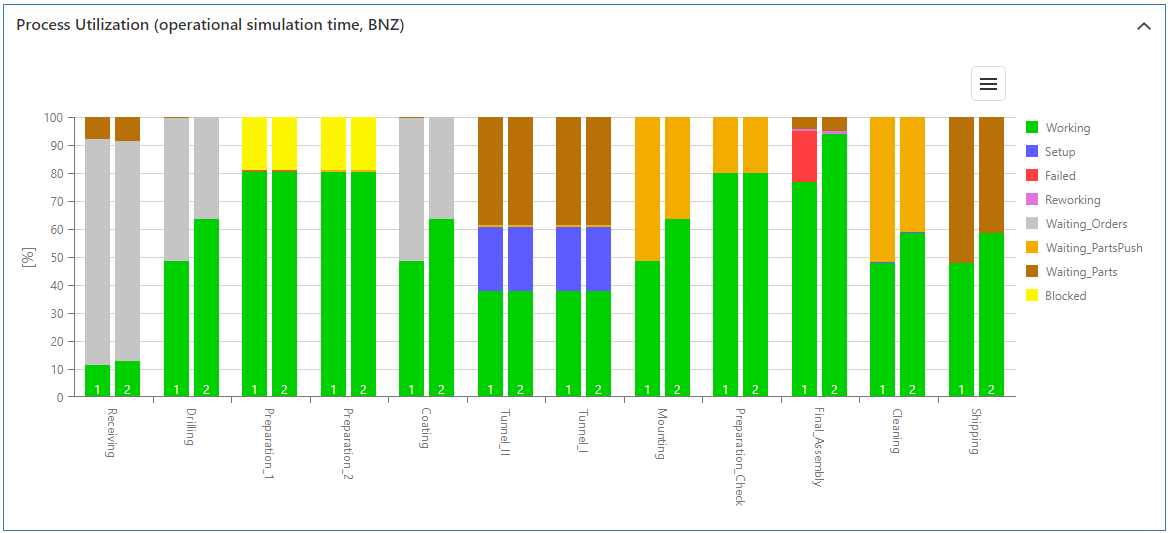
Figure 5 - Process Utilization (operational simulation time, BNZ)
5. Process Utilization data (operational simulation time, BNZ)
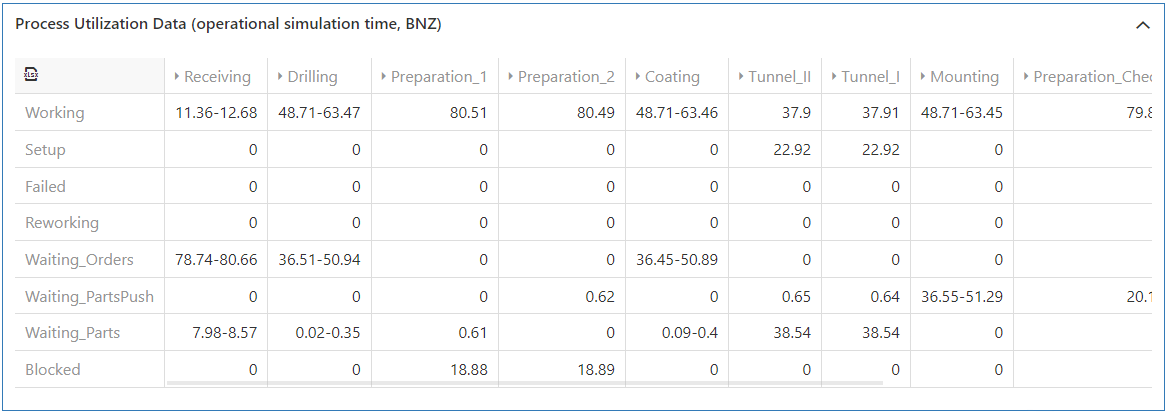
Figure 6 - Process Utilization data (operational simulation time, BNZ)
6. Rework - Process Utilization (whole simulation time)
This diagram contains utilization statistics separately for rework stations, analogous to the process overview (see 1. Process Utilization (whole simulation time).
The diagram only appears if a rework object has been inserted in a modeling alternative. The diagram representation is again supplemented by a table representation.
7. Rework - Process Utilization data (whole simulation time)
cf. 6. Rework - Process Utilization (whole simulation time)
8. Rework - Process Utilization (operational simulation time, BNZ)
This diagram contains process states separately for rework stations, normalized to the operating utilization time, analogous to the process overview (see 4. Process Utilization (operational simulation time, BNZ).
The diagram only appears if a rework object has been inserted in a modeling alternative. The diagram representation is again supplemented by a table representation.
9. Rework - Process Utilization data (operational simulation time, BNZ)
cf. 8. Rework - Process Utilization (operational simulation time, BNZ)
10. Number of workers (defined vs. theoretical)
The diagram in Figure 7 compares the parametrized and theoretically calculated number of workers for each process.
The theoretical number of workers results from the product of the process utilization and the defined number of workers. (formula Theoretical number of employees, process utilization)
|
Warning: Due to this dependency, the theoretical number of employees only represents a workload of the employees depending on the assigned machine and is expressly no recommendation for employee planning! (The user must be aware that application cases, such as a necessary number of employees for loading and unloading machines with an otherwise low need for employees, cannot be taken into account with this calculation approach). |
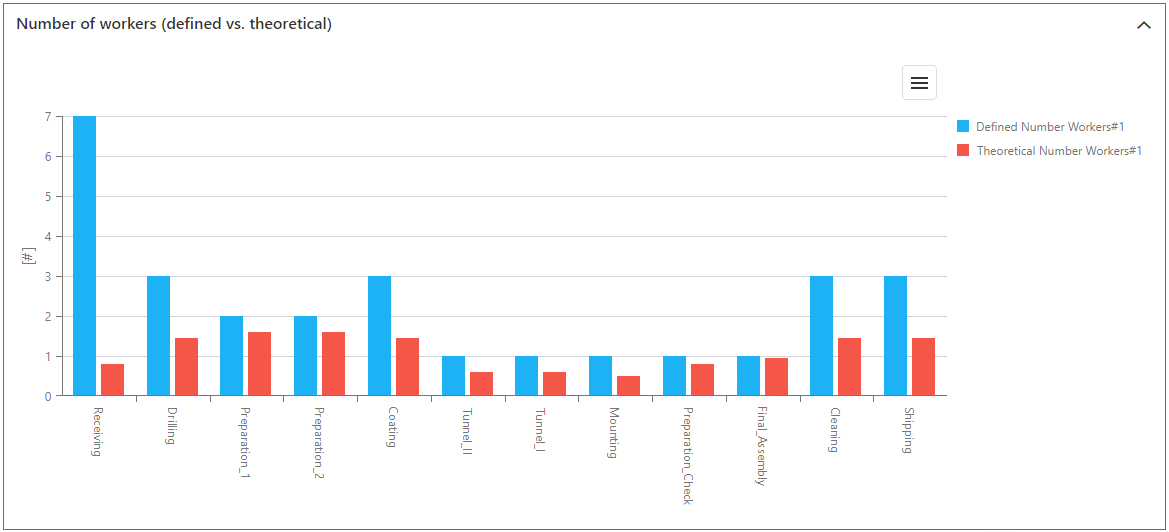
Figure 7 - Number of workers (defined vs. theoretical)
© SimPlan AG - Hanau District Court, Commercial Register (Part B) 6845 - info@simplan.de - www.simplan.de/en