This results section provides stock statistics at part level for each Inventory object (Inventory and supermarket) over time.
The values are broken down into time intervals for which the minimum, maximum, and time-weighted average stock is specified.
The count for stock entry takes place when parts are entered and when parts are exited (each on a carrier). The data series are recorded per part type.
Contents
1. Stock – [object name] – Filling level (min, max, weighted average in [parts])
2. Supermarket – [object name] – Filling level (min, max, weighted average in [parts])
3. FIFO – [object name] – Filling level (min, max, weighted average in [parts])
Figure 1 shows an overview of individual distributions of the key figure Stock Statistics Parts.
The number of elements depends on the objects used in the respective modeling and the existing products of the respective objects.
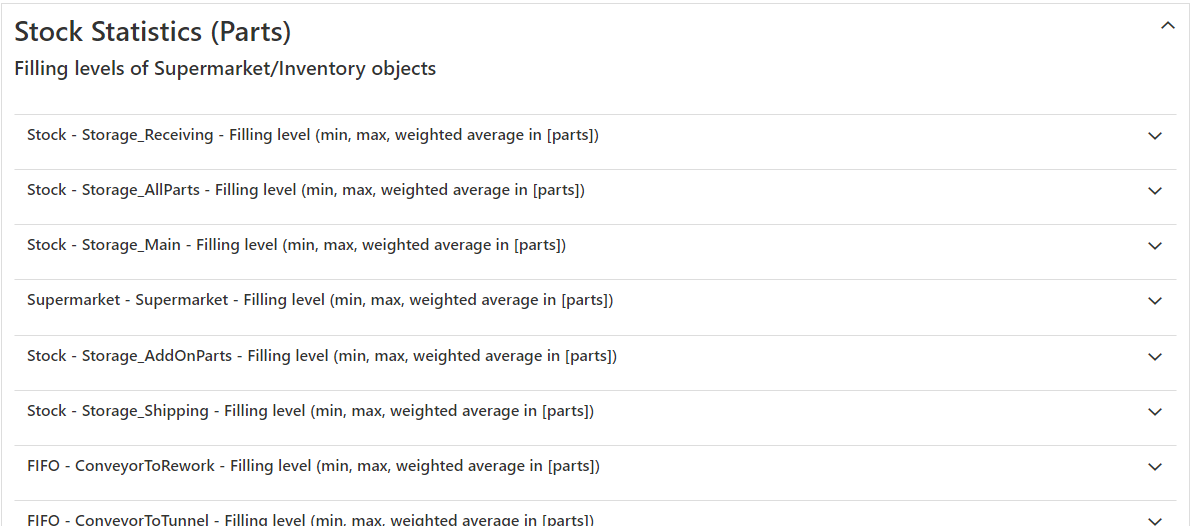
Figure 1 - Stock statistics (parts) overview
1. Stock – [object name] – Filling level (min, max, weighted average in [parts])

Figure 2 - Stock – [object name] – Filling level (min, max, weighted average in [parts])
2. Supermarket – [object name] – Filling level (min, max, weighted average in [parts])

Figure 3 - Supermarket – [object name] – Filling level (min, max, weighted average in [parts])
3. FIFO – [object name] – Filling level (min, max, weighted average in [parts])

Figure 4 - FIFO – [object name] – Filling level (min, max, weighted average in [parts])
© SimPlan AG - Hanau District Court, Commercial Register (Part B) 6845 - info@simplan.de - www.simplan.de/en