For each process object, this section lists the waiting time statistics for base products in table form.
For each station, both the sum of critical waiting times (waiting times for the last base product) and the average per waiting time of a base product are listed.
Contents
1. Waiting times (sum) for latest (/critical) base products per stationfinal product generation
2. [Object name] - Waiting Times (SUM) for latest Base Products per stationfinal product creation
3. Waiting times (average) for each base product per stationfinal product generation
4. [object name] - Waiting Times (AVG) for each Base Product per stationfinal product creation
Figure 1 shows an overview of individual distributions of the key figure process waiting times to basic products. The number of elements depends on the objects used in the respective modeling.
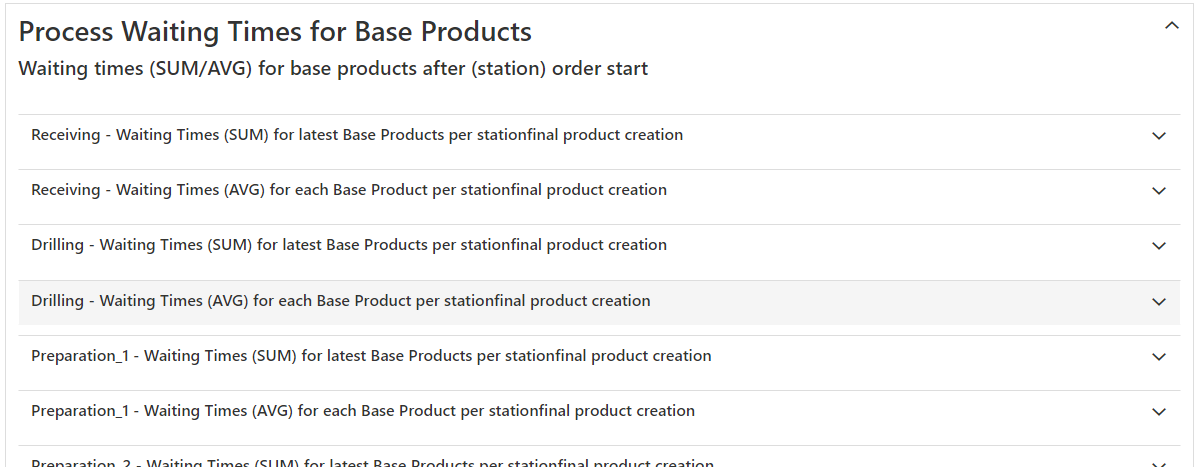
Figure 1 - Process Waiting Times for Base Products overview
1. Waiting times (sum) for latest (/critical) base products per stationfinal product generation
For each station final product, the last arrived base part is determined and the waiting time difference is added to the critical base part statistics.
The sum of the waiting times for the base parts corresponds to the percentage share Waiting_Parts in the process status overviews.
|
Note: Time parts of the process object that are not waiting are thus also excluded from this statistic. For example: if a base part is waited for, but in the meantime a pause occurs at the station |
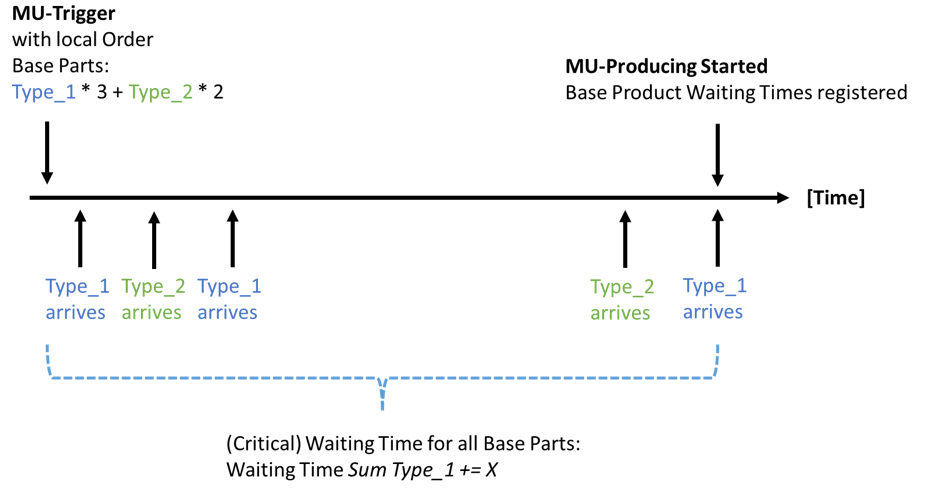
Figure 2 - (critical) waiting time (SUM)
2. [Object name] - Waiting Times (SUM) for latest Base Products per stationfinal product creation
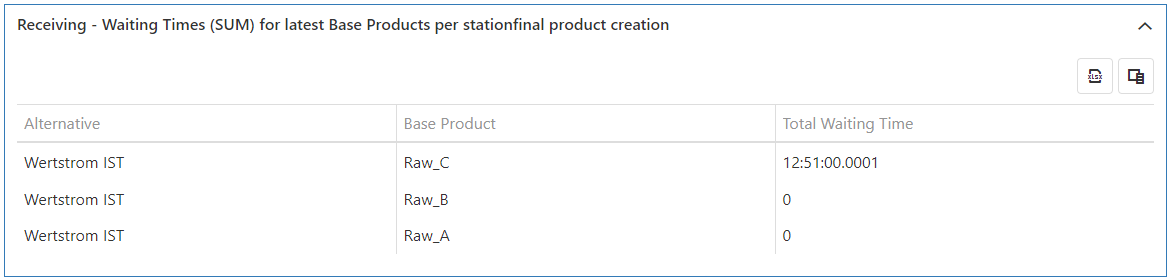
Figure 3 - Waiting Times (SUM) for latest Base Products per stationfinal product creation
3. Waiting times (average) for each base product per stationfinal product generation
Additionally, the average of the waiting times for each station-final part is calculated for all arrived base parts.
Here the non waiting times of process states are not excluded (see 1.). Furthermore, only parts from completed orders are considered.

Figure 4 - (critical) waiting time (AVG)
4. [object name] - Waiting Times (AVG) for each Base Product per stationfinal product creation

Figure 5 - Waiting Times (AVG) for Base Product
© SimPlan AG - Hanau District Court, Commercial Register (Part B) 6845 - info@simplan.de - www.simplan.de/en