This results section contains throughput statistics for process objects at part level, which are also broken down into good parts (IO), bad parts (NIO) and rework parts.
In addition to the throughputs per hour and per day for each process object, the diagrams also provide an overview of the average process throughputs per hour in the operating time (number of accumulated parts divided by the operating time in the simulation time without statistical reset) and an overview of the total throughputs at part level.
Contents
1. Overview average throughput of processes per [h] in BNZ - cumulated parts (IO, NIO, REWORK)
2. Overview total throughput of processes - cumulated parts (IO, NIO, REWORK)
3. [Object name] – Throughput parts (IO, NIO, REWORK) in [h]
4. [Object name] – Throughput parts (IO, NIO, REWORK) in [d]
Figure 1 shows an overview of individual distributions of the key figure process throughput. The number of elements depends on the objects used in the respective modeling.

Figure 1 - Process throughput statistics overview
1. Overview average throughput of processes per [h] in BNZ - cumulated parts (IO, NIO, REWORK)
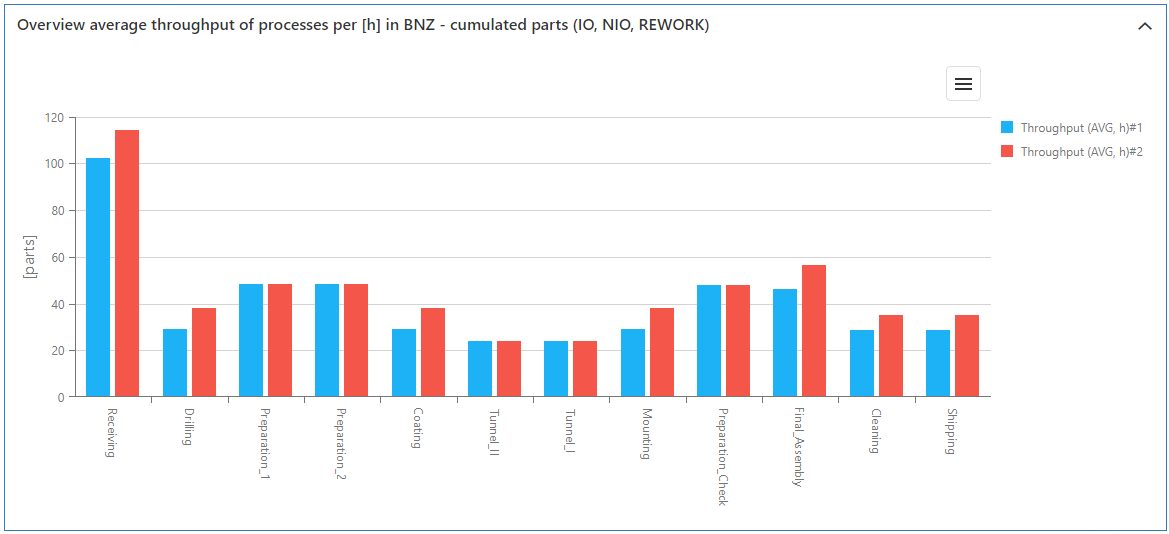
Figure 2 - Overview average throughput of processes per [h] in BNZ - cumulated parts (IO, NIO, REWORK)
2. Overview total throughput of processes - cumulated parts (IO, NIO, REWORK)
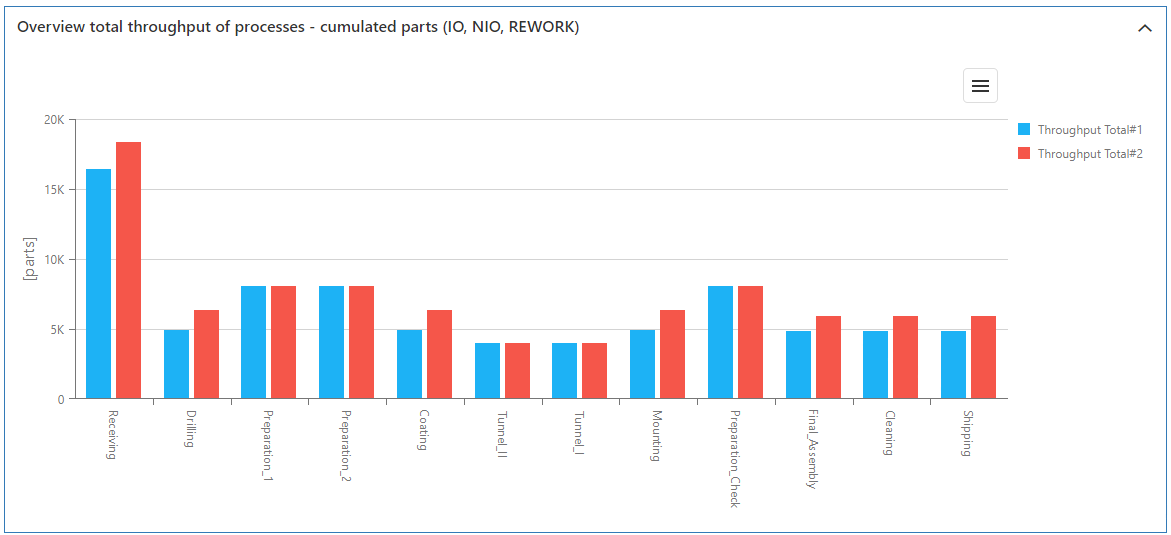
Figure 3 - Overview total throughput of processes - cumulated parts (IO, NIO, REWORK)
3. [Object name] – Throughput parts (IO, NIO, REWORK) in [h]

Figure 4 - [Object name] – Throughput parts (IO, NIO, REWORK) in [h]
4. [Object name] – Throughput parts (IO, NIO, REWORK) in [d]
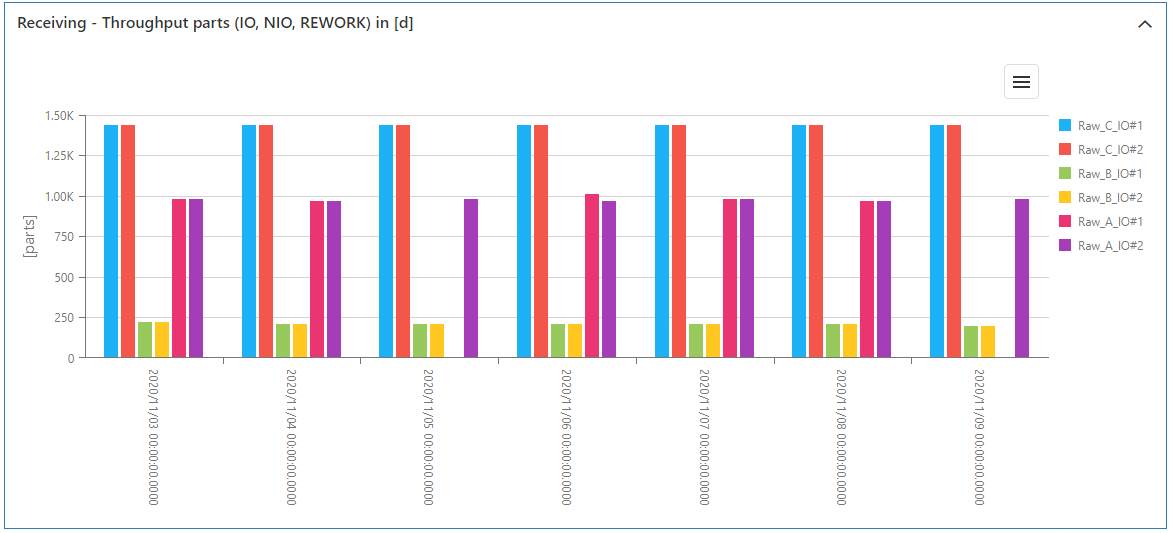
Figure 5 - [Object name] – Throughput parts (IO, NIO, REWORK) in [d]
© SimPlan AG - Hanau District Court, Commercial Register (Part B) 6845 - info@simplan.de - www.simplan.de/en